Kanban for HR
How HR teams can use Kanban to improve visibility, manage workload and deliver better outcomes for the business.
Home » Let’s take Kanban beyond IT » Kanban for HR
I’ve been working with a number of HR teams recently to help them to take advantage of Kanban techniques. Each HR department was 6-12 people in size working for orgs with a headcount of 600-1200 people. It’s been a really fascinating journey having learned so much about a new domain and finding very similar problems to that faced within software development. The main challenges facing the HR departments that I’ve been working with were:
- Demand on the team outstrips their capacity to service it – usually resulting in the team having to soak it up with working long hours and home working at the weekends just to keep on top of things
- Prioritisation is usually by whoever shouts loudest
- Many dependencies and hand-offs to other functional areas / departments such as IT, Facilities, Legal, and Finance
- Delivery against deadlines is regularly jeopardised due to the unpredictability of teams they depend on resulting in a brute force approach to hitting deadlines (see first point)
- An eroding reputation within the organisation due to missed SLA’s, missed deadlines, and slow responsiveness resulting in low team morale.
All of the teams used a variety of Human Resource Software Products in an attempt to automate and manage aspects of the workflow. A quick look at the marketplace for this kind of software shows the vast array of options available. One thing all of these products have in common is that they forget about the importance of face to face interaction and collaboration in favour of process automation tooling. They also mask complexity in terms of HR team capacity and prioritisation.
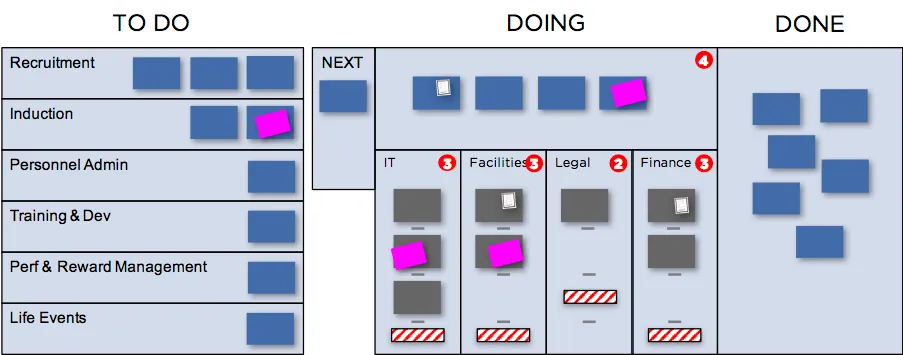
Kanban for HR – the card wall
For each team I started with this basic card wall design. From here, each team evolved the card wall to meet their own needs and processes but I found this to be a useful starting point:
Work Visualisation
The physical card wall provided a level of visibility never experienced before for the team and their stakeholders. Making the work visible was a pretty big step for all teams involved. All teams had far too much work in progress and it was evident they didn’t have strong prioritisation and selection policies in place. The introduction of the card wall helped in making prioritisation policies explicit.
Behaviours
Team behaviours changed – big time. Not just within the HR team but relationships with other teams were greatly strengthened. Team members from other teams started to attend the HR daily stand-up to see what work they had coming up and could surface blockers more effectively.
Blockers
Visualising when work was blocked using magenta post-it notes really helped to improve predictability by bringing more focus to removing the blockers. Prior to Kanban, when work was blocked they would just pick up the next piece of work to “keep busy” resulting in big delays for the blocked work items. Since the blockers were introduced the team escalate where necessary to remove the blockers and have greatly reduced the variation in their process.
Work In Progress limits
All teams initially had far too much work in progress. This seemed to come as a big surprise to most teams. I think this was due to the electronic system hiding this. Some teams struggled to implement and stick to WIP limits but they did acknowledge they had far too much WIP and worked to reduce this. The consistent result of reducing WIP was an increase in team throughput. In the diagram above you’ll see we prefer to use physical limiters which are represented by a white bar with red diagonal stripes on it (“barber-shop poles”).
The NEXT column
This column provided a clear point of prioritisation and selection. The team met regularly to replenish this column. Looking across the many sources of demand and work types they selected the next two items from the backlog and placed them in the NEXT column. From here, the team pulled them into ‘doing’ but only when they had the capacity to deal with it.
The DOING column
This column was subdivided to represent the hand-offs commonly associated with a busy HR department. The top row of this column represents the work in progress for the HR team. This is limited to 4 work items max. The sub columns within this column represent any work items handed off to other teams. For example, onboarding a new employee requires work to be done from IT, Facilities, Finance and Legal. To track this activity, HR move their ‘New Starter’ work item from their doing column into the IT column to show the work item is with IT. Once IT have completed their work the card can then move to other departments for further work. To bring this whole process together the HR team requested the attendance of each department (one representative) at their daily stand-ups. To avoid overloading teams like IT or Finance the HR department placed a limit on the amount of work they gave to each department.
Backlog visualisation
Making all the work types visible in the backlog really helped with showing how much the team had on. The main work types were Recruitment, Induction, Personnel Admin, Training & Development, Performance & Reward Management, and Life Events. Some teams opted to colour code the cards by work type.
Avatars
By having one Avatar per person on the team using them to indicate what everyone was working on really helped to quantify the team capacity. It also indicated where the team focus was to ensure they were focusing on finishing work rather than starting new work. The avatars in the above diagram are represented by the small white stickies on the cards.
Metrics
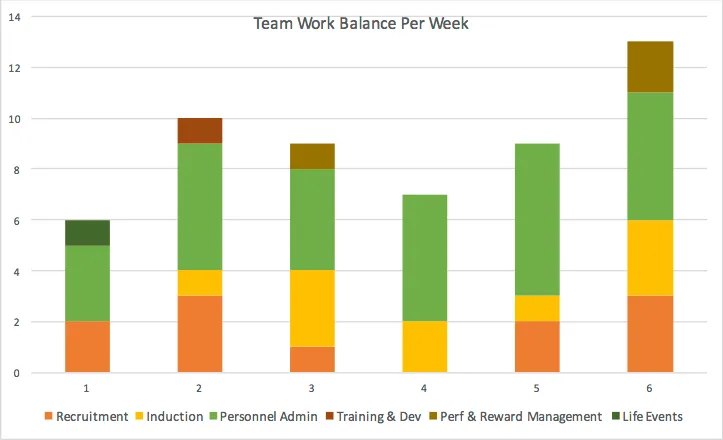
The following work balance chart were used to show how the team capacity was being used on a week by week basis. The chart is used to support the selection process in the NEXT column.
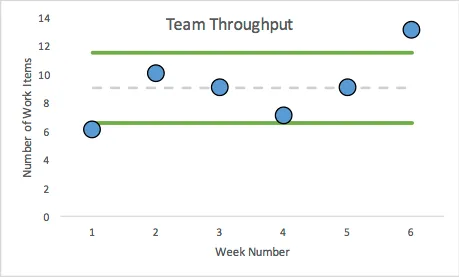
The cycle time control chart turned out initially to be very difficult to create. This was due to the HR workflow automation software not supporting basics such as date/time stamps of when work started to when it completed. I was able to create some custom fields in most of the apps to capture the required data but they didn’t do it out of the box and hence wasn’t captured. By tracking cycle time we hope to understand more about variation in the process. In addition to the cycle time control chart we produced a weekly throughput control chart.
Practices
We took advantage of a number of other practices from the Agile community:
- Daily stand-ups – were introduced and accepted as a real positive. Prior to this the HR teams did a weekly team meeting lasting about an hour. They were surprised at the interest from other teams such as IT, Finance, Legal and Facilities who regularly attended their stand-ups and improved collaboration.
- Retrospectives – every two weeks the teams got together and looked at their ways of working. They identified actions for improvement and implemented them. From these retrospectives each team embarked on their own journey of discovery about what worked well and what didn’t. Each of the teams now have very different card walls as a result of constantly analysing and adapting their ways of working.
- Swarming – the concept of individuals swarming around the card wall to reduce bottlenecks and focus on end-to-end flow.
- Pairing – Encouraging individuals to pair up to spread the knowledge of particular specialities within the team and to improve flow when pairing across departmental boundaries. Pairing also helped to increase overall team throughput.
Related articles
A Kanban System for Law Firms Legal Practices
How law firms and legal practices can apply Kanban to manage caseloads, improve turnaround times and deliver a better client experience.