Scaling your Agile teams? 3 warning signs to watch for
Three early warning signs that your Agile scaling effort is going wrong — and what to do before things get worse.
Home » Let’s scale our teams » Scaling your Agile teams? 3 warning signs to watch for
This article explores how your organisational design (OD) decisions impact organisation performance and three warning signs that might help you to understand if your teams are aligned to purpose.
From Wikipedia: Conway’s law is an adage named after computer programmer Melvin Conway, who introduced the idea in 1968; it was first dubbed Conway’s law by participants at the 1968 National Symposium on Modular Programming. It states that
“organizations which design systems … are constrained to produce designs which are copies of the communication structures of these organizations”, M. Conway
Team Structure Common Patterns
In my work across large-scale software development organisations I’ve observed a number of different ways that teams are commonly structured and organised:
By work type:
- Support & Maintenance
- Projects
By feature / functional area:
- Registration & Login
- Search
- Results Page
- Transact
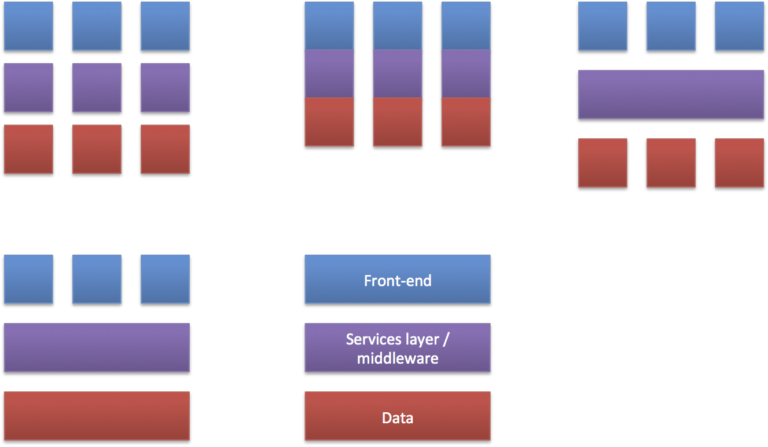
By architectural layers:
- Front-end
- Services layer / Middleware
- Backend / data
By technology skills (often called “Centre’s of Excellence”):
- HTML / Javascript
- Node.js
- Java
- Mongo DB
By roles:
- Product Owners
- Business Analysts
- Developers
- Testers
- Release Engineers
Agile first introduced the idea of cross-functional teams rather than organising teams by role. Even if we go down an architectural layers split or functional split for teams there are still further decisions and challenges you’ll face. The following diagram attempts to illustrate the various ways I’ve seen cross-functional teams organised.
For smaller orgs with a single team of say 5-20 staff, scaling is often a non-issue. But when orgs scale and start hitting the 100’s (or even 1000’s) of staff across multiple teams – often in multiple locations, org design becomes a critical decision.
I’ve spent many hours in discussion with clients looking at the best way to organise teams and align purpose. Should we organise in vertical slices through the whole tech stack into feature teams? What about having front-end teams with shared service teams for middleware and data?
You will hear many conversations about trade-offs of each and to be honest there’s no standard blueprint. There are however some signals that you should watch out for that may indicate that your teams are not cut in an optimal way. Kanban provides us with some great techniques and metrics to help us to spot the signal that we’re possibly feeling the negative effects of Conway’s Law.
Signal #1: Demand Splitting
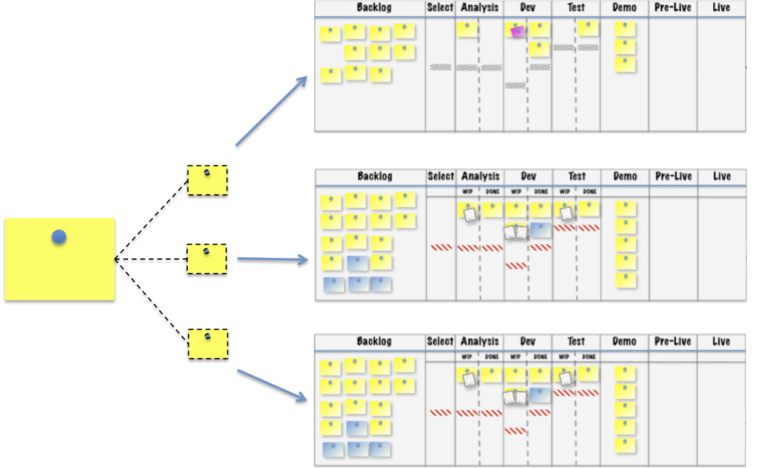
Constantly breaking up stories or requirements to be delivered across multiple teams may indicate you’re fighting Conway’s Law. There are always occasions when a requirement can only be delivered by using multiple teams but this should be the exception and not the norm. If it does become the norm, think about re-organising the teams so a single group of capabilities can deliver the value without splitting the requirement.
Signal #2: Hand-offs
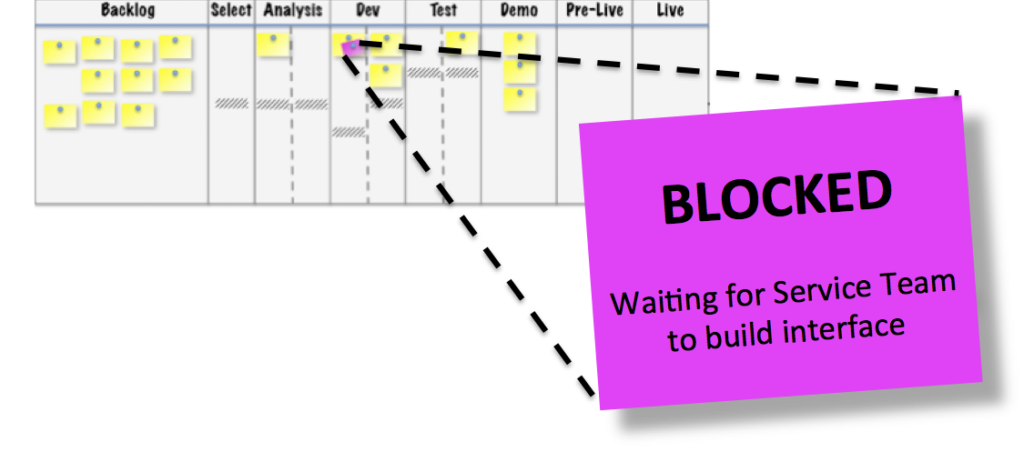
A really important aspect of any Kanban system is the visualisation of blockers. Work can get blocked for many reasons but a potential signal from Conway is when you’re blocked due to waiting on another team to complete some development work before you can continue. A common blocker I see across many Kanban systems is hand-offs between teams aligned by architectural layers. Again, occasional blockers in this form may not be an issue but when it feels like all work has a dependency on another team then you really need to think about re-architecting your organisation (Reverse Conway’s Law) or re-architecting your platform (Conway’s Law). As an aside, it’s interesting how much effort I see project managers putting into dependency management and planning to work around the effects of Conway’s Law.
Signal #3: Patterns in Cycle Time Data
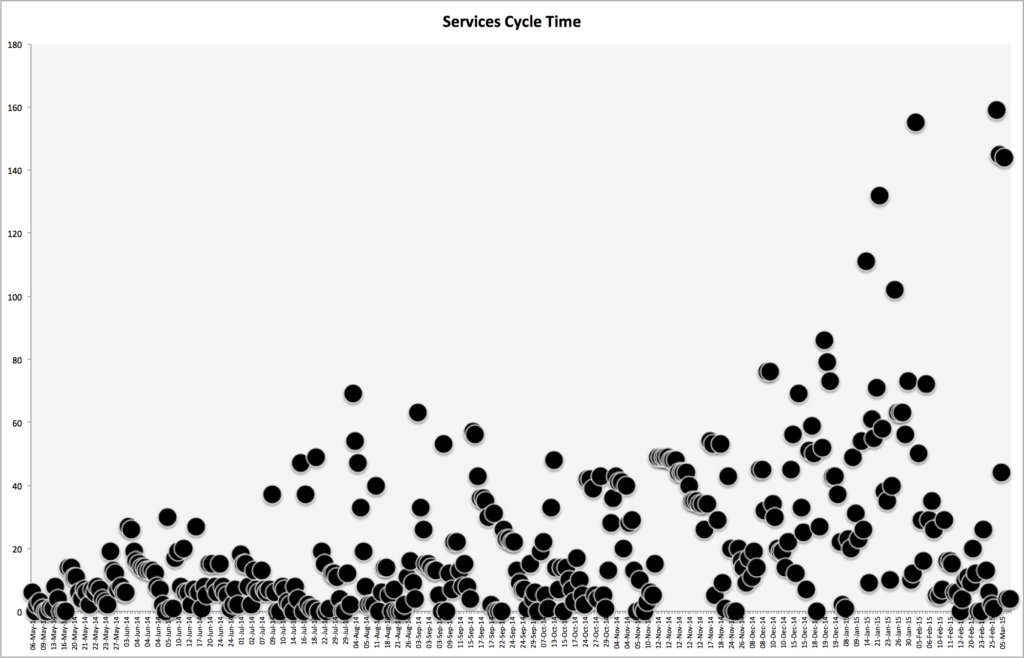
Limiting the amount of work in progress, focusing on end-to-end flow, and focusing on removing blockers should reduce variation in cycle time – and I’ve got lots of data to support this. However, in the chart above we can see cycle time variation fanning out and up. If we see this same pattern across multiple teams then this might be another signal.
Ideally I’d like to see data to show the impact of org decisions on cycle time but as yet, I haven’t been able to record this. At the very least I’m hoping this blog post will inspire others to capture data and provide additional thoughts on sources of variation at scale.
Related articles
Portfolio Kanban – your free practical guide to delivery at scale
In this free practical guide we take you through how to deliver software and services at scale using Portfolio Kanban.
17 Dependency Management Hacks to Improve Flow Efficiency
Improve project delivery predictability with these 2 strategies and 17 practical and easy to implement dependency management hacks.
Agile Organisation Structure
How to structure your organisation to support Agile delivery — team topologies, reporting lines and the common traps to avoid.